Gold Price Trends Live Golds US Dollar Nexus
Observing the interconnected relationship between the price of bullion and the United States economy provides a fascinating insight into the dynamics of global finance. This intriguing correlation is epitomized by the fluctuating trends in the value of the precious metal, highlighting its significant role as an investment asset.
In the United States, for example, the price of gold often acts as a response mechanism to economic uncertainties, given its established reputation as a reliable financial hedge.
In the field of numismatics, Rechant Precious Metals, a respected coin and bullion dealer based in West Palm Beach, Florida, has been consistently offering valuable insights into the gold market since its establishment in 1975.
Making a Wise Decision
Taking a closer look at global economies and their intricate association with the gold price, one realizes the uncanny balancing act inherent in investment decisions. Delving into this concept further, one sees how the sturdy and enduring nature of precious metals, especially gold, could be seen as a sound and informed addition to one's financial portfolio or holding.
Uncertain Times Ahead in 2024
However, as we steadily gaze into the uncertain landscape of the pivotal year 2024, one cannot overlook the inherent risk radiated by the unpredictable shifts in the price of gold.
Key events such as changes in a central bank's monetary policy, whether it directly impacts the Japanese yen, Euro, or Swiss franc, consistently shape and steer market movements.
The Dynamic Between Consumer Price Index and Market Fluctuations
This brings into sharp relief the bond between the Consumer Price Index and stock market volatility, hence the emphasis on data interpretation as the linchpin of prudent investment decisions. Savvy investors recognize the importance of closely tracking the spot price of gold, considering the profound effect its fluctuations can impart on their financial well-being.
They adapt their strategies in response to market trends influenced by various factors like the Japanese Yen, Euro, Swiss Franc and central bank policies, a process fundamentally guided by Consumer Price Index data.
The Role Of Central Banks In Gold Pricing
As we explore the world of gold investment, we turn our attention to the entities controlling our global economy. Central banks, possessing considerable power over financial markets, hold a dominant role in influencing the dynamics of gold pricing. Actions undertaken by these monetary behemoths cause observable fluctuations in the price of this highly valued precious metal.
The Impact of Gold Reserves on Central Banks
Central to this economic activity, gold reserves historically serve as indicators of strength and stability for central banks. Thus, one cannot ignore the immense influence central banks wield over the balancing act of gold pricing — their decisions fundamentally shaping the gold market. In this context, it becomes evident that the amount of gold stored in these institutions' reserves can greatly affect its market price per ounce.
Understanding Policy Outcomes
Further, familiarity with the outcomes of the strategies executed by these monetary giants is crucial in foreseeing variations in gold and silver pricing. For instance, an increase in their bullion reserves can stimulate demand, inevitably leading to a surge in the gold price. Unravelling these complex interconnections of economic relationships and strategies leads to more informed investment decisions.
Key Points on the Influence of Monetary Authorities on Gold Valuation
- Dominant central monetary policies craft market dynamics that trigger substantial changes in gold pricing.
- Historically, gold reserves have been associated with the authority and stability of these monetary establishments, influencing the current gold pricing.
- The stash of gold held by these entities could significantly impact the market value of the metal per ounce.
- Strategies like increased bullion acquisition by these authorities can influence demand and result in a rise in gold price.
Understanding the Gold Price Chart
In alignment with our journey through economies, financial markets, central bank policies, and Gold as an investment, we arrive at the threshold of comprehending gold price charts. They initially resemble an unfamiliar language, promising significant rewards once deciphered, for both beginner investors and seasoned traders.
Think of these charts as the steering wheel for your potential investment decisions in gold. Mastery over them requires a deep dive into their fundamental components, the factors that contribute to shifts in the live gold spot price.
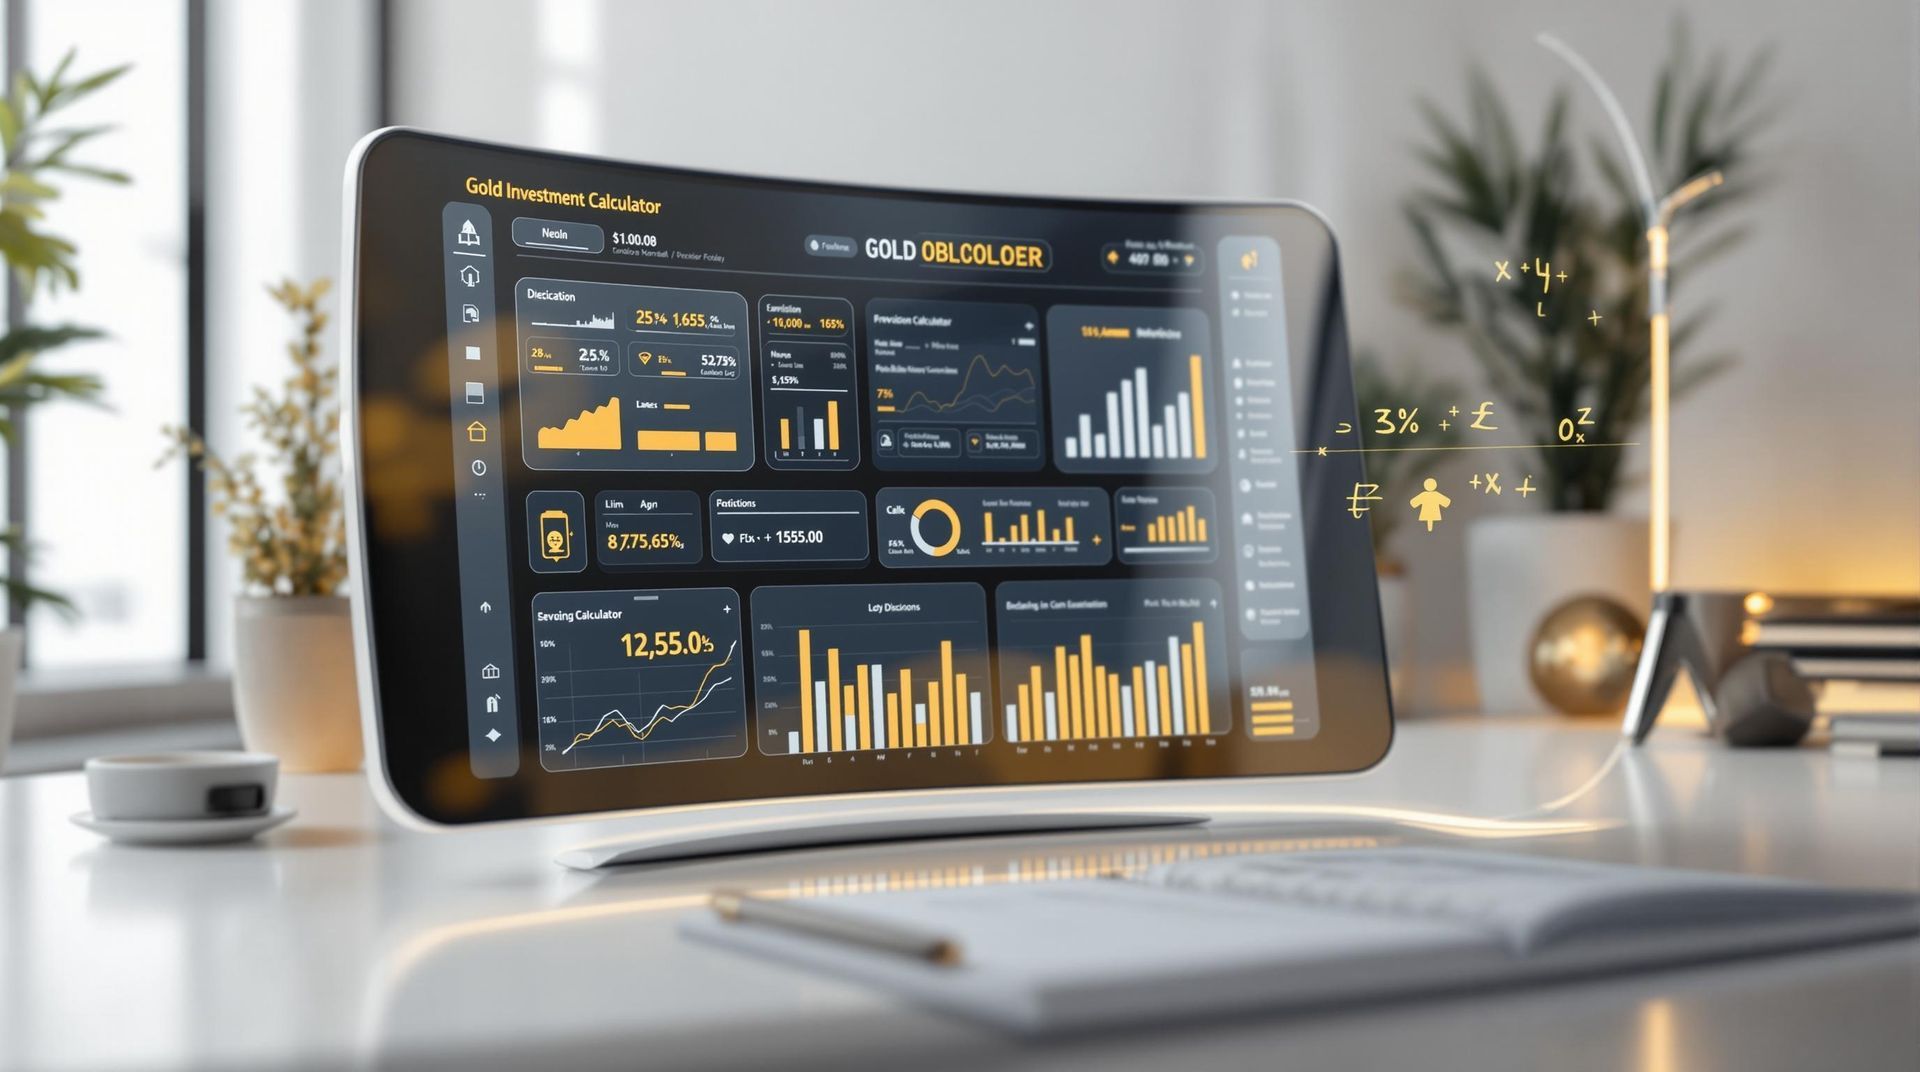
In essence, a live gold price chart is a visual display, wherein the X-axis symbolizes the period under study, while the Y-axis depicts fluctuations in gold prices, usually price per troy ounce. For acquiring a detailed understanding of the gold market's dynamism, it's necessary to grasp the patterns in these gold price trends, their peaks and troughs.
The live gold price chart employs color codes and markers guiding you to comprehend the bull (rising) and bear (falling) market trends. These aids illuminate the spot price of gold, historical gold price data, and gold price per troy ounce, constituting a holistic snapshot of the gold market's activity.
Although the nuances might appear intimidating initially, gaining knowledge empowers the ability to decode patterns, appreciate the Consumer Price Index's role, fathom the effect of diverse currencies such as the Japanese Yen, Euro, Swiss Franc, and how central bank decisions impact gold price trends. Superior command over these charts can indeed transform investors into expert navigators, effectively steering amidst the shifting currents of the gold market.
The History And Future Of Gold Prices
Beginning with the prevailing sway of central banks and interpreting the gold price chart, our journey sweeps us through many centuries, all shimmering with the enchanting appeal of gold. From time immemorial, gold has endured countless price changes, invariably fascinating collectors, regular buyers, and investors. Grasping these price variations is crucial, whether you're involving yourself with gold coins, gold futures, or gold jewelry.
Every twist in the chronicles of gold pricing mirrors our world history's rich mosaic. Significant global events such as wars, economic downturns, and periods of inflation have caused waves in the gold market. Emphasizing this fact are the peak gold prices witnessed during the 2008 financial turmoil and more recently, while battling the worldwide pandemic.
Investors often find themselves navigating a complex market landscape that is affected by a myriad of factors, including the Japanese yen's worth, and the past performance. Despite these elements causing the gold to appear more expensive currently, the irresistible attraction of gold coins, futures, physical gold, and its all-time high prices remains. This environment prompts an increase in gold trading and a rise in monitoring live gold data through various gold price sites for scrutiny of gold price charts in ounces.
Despite the currently strong price per ounce, gold continues to beguile, partly driven by its historical high performance. The global gold trade is indeed an intriguing arena, mirrored in the everlasting allure of this precious metal.
Spreading Investments Across Silver and Gold
As we expand our knowledge beyond merely understanding gold, it's crucial to spotlight other metals with high value, specifically silver and gold. These precious metals carry tremendous importance as effective means of broadening investment portfolios. Possessing detailed understanding into the elements guiding their prices, including influencing factors like consumer price index and interest rate, rewards a savvy investor with strategic decision-making capabilities.
Looking Back to Move Forward: Analysing the past and present of silver and gold prices over the years reveals a steadfast quality these metals possess - resilience. Amidst fluctuating economic scenarios, these commodities have displayed an appealing endurance in value, proving to be a haven for investors during challenging financial times.
Understanding the history and trends of these assets often offer insightful indications, greatly improving investment decisions by illuminating possible future results.
Understanding the Economic Dance of Precious Metals: To leverage the full potential of investing in gold and silver, it's vital to understand the inherent connection between their value and economic indicators. The current price, or spot price for gold is typically stated in the US dollars. Moreover, it varies under the influence of several factors like changes in the consumer price index (CPI), movements in silver prices, significant interest rate reductions, and the countdown to the year 2023. These prominent contributors can shape the future of gold's value, potentially positioning it as a reasonably priced investment option and a crucial determinant in future gold prices, with predictions hinting at a value spike up to 2000 per ounce.
Understanding Market Data for Gold Investments
When focusing our gaze on precious metals, especially gold, an essential stride is understanding the layered nuances of market data. This understanding aids smooth sailing through the volatile waves of the gold market, turning these fluctuations into potential gold price chart investment opportunities.
Deciphering Gold's Glow: Teasing out the vital trends of gold's 'price movements' is a notable activity among experienced investors.
The actions of buying or selling gold from central banks could have a significant impact on these price fluctuations. So, gaining expertise in understanding important market indices becomes fundamental for making apt Gold as an Investment decisions.
Decoding the Gold Puzzle: Understanding the gold market isn't limited to analyzing the 'gold's price' listings alone. It extends further to interpreting the trends displayed in Gold as an Investment charts found on the 1 gold price site. This site features data expressed in terms of the US dollar. It tackles aspects such as the gold standard, gold's involvement in various goods, and price movements of Gold.
These charts could also show how inflation, central bank buying habits, and comparisons with other investment options such as real estate and stocks affect the cost of gold for foreign investors. Examining these trends can guide potential investors, priming them for near-future buying or selling. The historical data serves as a beacon, suggesting if the gold price will escalate or move even closer to the 2000 per ounce mark, possibly acting as a hedge against inflation.
Essential Points About Gold Investment
- Experienced investors constantly delve into gold 'price movements,' a critical performance indicator.
- Policies implemented by central banks to purchase gold or sell gold can provoke significant fluctuations in gold price trends.
- Cracking the gold market code isn't just about casually examining 'priced' listings; it transforms into grasping the wave-like trends depicted on charts.
- Aspects such as the gold standard, the extent of gold's presence in various goods, and shifts in gold's prices, typically expressed in US dollars, require scrutiny.
- Historical data hints that gold can be a shield against inflation, especially if it approaches or surpasses 2000 per ounce.
Sell Gold Jewelry Unmask Hidden Worth
Gold Selling Price Live Gold Spot Price Today Per Gram In USD


